
Introduction
Artificial intelligence (AI) has increasingly enhanced human activity by making processes faster and more efficient (Masyitoh et al., 2024; Tai, 2020). In Indonesia, the adoption of AI technologies gained momentum during the COVID-19 pandemic (Nurmaini, 2021), influencing various sectors, including education (Ahmad et al., 2023; Yusriadi et al., 2023). AI tools now support educational management by facilitating learning activities, improving student outcomes, and reducing operational errors (Bit et al., 2024; Costa et al., 2017; Igbokwe, 2023). Moreover, the impact of AI has revolutionized education, especially at the higher education level (B. Chen et al., 2023; Chiu, 2023).
Many applications of AI in education (AIED) have emerged (Choi et al., 2022; S. Wang et al., 2024). AI tools are available to support students in completing tasks they thought were beyond their capabilities (Kasneci et al., 2023). Potential applications of AIED can cover several areas of educational management, including three categories such as intelligent tutoring systems, personalized learning, and assessment automation (Sain et al., 2024; Wollny et al., 2021). AIED for intelligent tutoring systems such as Khan Academy and Duolingo (Bicknell et al., 2024; Ocaña-Fernández et al., 2019), can facilitate student learning due to the ability to actively interact with students and provide various feedback (Kamalov et al., 2023). Furthermore, AIED in personalized learning like ChatGPT and Sora is possible given the scalability of AI across students because AI algorithms such as reinforcement learning can be used to dynamically learn and adjust the learning process accordingly (Kamalov et al., 2023; Leh, 2022; C. Weng et al., 2024). In Indonesia, ChatGPT is the most widely used AI application (Helmiatin et al., 2024), this platform is anticipated to greatly improve the quality of the educational experience (Kuhail et al., 2023). Then, AIED in assessment or ranking automation will provide tremendous relief for students, giving them more knowledge and analysis of wrong and true answers (Kamalov et al., 2023), University E-learning and iFlyTek are parts of this AIED category (iFlyTek, 2024; Janpla & Piriyasurawong, 2020; Rodriguez-Ascaso et al., 2017). Overall, AI tools have been able to revolutionize higher education in the areas of learning, teaching, and assessment (Michel-Villarreal et al., 2023; Ruiz-Rojas et al., 2023).
These AI tools have also been recognized to provide significant benefits in improving the quality of learning in higher education (Zhou & Zhang, 2024). The application of AIED, especially in promoting students' self-directed learning (SDL), has shown significant contributions (Mahendra et al., 2023). Self-directed learning refers to the process where individuals take initiative and responsibility for their own learning, in this concept individuals are free to set goals, resources, determine what is worth to learn, and evaluate the results independently (Loeng, 2020). The features offered by AIED can facilitate students in the learning process, including SDL (Foroughi et al., 2023; Yildirim et al., 2023). However, research related to factors that influence student acceptance of AI is still very limited.
Despite the adoption of AI tools has expanded rapidly, research on AIED remains relatively very limited, specifically in developing countries such as Indonesia. A Scopus data analysis conducted by Helmiatin et al. (2024) indicates that from 2015 to 2024, research on AI has been predominantly led by authors from North America, Europe, and several Asian countries such as China and India. Moreover, most published studies on AI are concentrated in other disciplines such as computer science (23%), engineering (14.8%), and medicine (13.6%). The growing use of AIED has also raised critical questions, regarding the factors that influence students continued and effective utilization of AI tools (Duong et al., 2024). This underscores a notable research gap in the exploration of AI's role in education within Indonesia, particularly in the context of its application for SDL among university students.
There has been no substantial study investigating the behavioral intentions of Indonesian higher education students or the factors influencing their decisions to use AI tools for SDL. To address this, the Theory of Planned Behavior (TPB) offers a relevant framework for understanding how attitudes, subjective norms, and perceived behavioral control shape behavioral intentions and actions (Ajzen, 1991). These three key factors play a significant role in shaping the decision-making process of users (Jiao & Cao, 2024). The use of AI tools in SDL can be seen as a behavior that can be analyzed using the TPB. However, TPB itself may not be able to fully determine the intention of university students in Indonesia to use AI tools in self-learning, due to other factors may have a greater influence.
This study also considers the Technology Readiness (TR) theory, developed by Parasuraman (2000), to explore factors influencing technology acceptance. Optimism and innovativeness of the users, which are positive readiness, are strong predictors of TR Kampa (2023). While TR also provides valuable insights like TPB, it may not fully explain students' intentions, as additional factors could play a significant role.
Additionally, the Technology Acceptance Model (TAM) emphasizes the role of perceived usefulness and perceived ease of use in shaping technology acceptance (Davis, 1986; Venkatesh & Davis, 2000). Past research has shown that perceived ease of use influences perceived usefulness but not vice versa (Chau, 1996; Folkinshteyn & Lennon, 2016; Holden & Karsh, 2010; Park & Park, 2020). Furthermore, existing studies have consistently highlighted the ease of use as a key driver of AI adoption in education (Algerafi et al., 2023; Almaiah et al., 2022; N. J. Kim & Kim, 2022). Considering this, there is no need to conduct another survey regarding perceived ease of use and only perceived usefulness will be included in this study.
Another theory related to technology use that can be considered is the Unified Theory of Acceptance and Use of Technology (UTAUT) by Venkatesh et al. (2012). UTAUT states that performance expectancy, effort expectancy, social influence, and facilitating conditions are significant determinants of user acceptance and usage behavior. However, the factors in UTAUT have similarities with some factors in other theories, such as perceived usefulness and perceived ease of use in TAM, and subjective norm in TPB (Chang, 2012; Venkatesh et al., 2003). UTAUT incorporates perceived usefulness into performance expectancy construct, perceived ease of use into effort expectancy, and subjective norm into social influence (Holden & Karsh, 2010; Venkatesh et al., 2003). Based on this, only facilitating conditions will be involved in this study.
Lastly, there is a factor that has emerged regarding a person’s intention to use AI tools, namely perception towards AI (Buabbas et al., 2023; Castagno & Khalifa, 2020). Several recent studies have also considered perception towards AI as one of the factors influencing intention to use it (Akudjedu et al., 2023; Al Omari et al., 2024). This factor needs to be considered in educational research, to find out whether this factor has a significant influence like in other fields.
To model these relationships, this study employs Artificial Neural Networks (ANN), a machine learning technique well-suited for identifying nonlinear behavioral patterns (German et al., 2022). By using ANN, this research not only tests the theoretical framework but also explores the relative importance and predictive strength of each variable.
The specific objective of this study is to explore the factors influencing Indonesian higher education students' intention to adopt AIED tools for SDL, using TPB. Various factors such as optimism, personal innovativeness, perceived usefulness, facilitating conditions, and perception toward AI will be considered for this study. This study is one of the pioneering research to explore the use of AIED in SDL among students using behavioral factors and additional factors to determine the intentions of students as AIED users. The results of this study can deepen the understanding of students' intentions in using AI tools in SDL, provide insights for educators and AI tool developers to optimize learning outcomes, and can help the government in considering facilitating more effective AI integration for higher education in Indonesia.
The other chapter in this study is outlined as follows: Section 3 describes the research methodology, covering participant or respondent recruitment, data collection, and the survey instruments employed. Section 4 focuses on the analysis and presentation of results. Section 5 offers a discussion of the findings, practical implications, research limitations, and recommendations for future studies. Lastly, Section 6 provides the conclusion of this study.
Conceptual Framework
The conceptual framework exploring the factors that potentially impact Indonesian higher education students' intentions to use artificial intelligence tools for SDL and explaining all hypotheses of this study. Figure 1 presents the conceptual framework employed in this study, highlighting the key factors incorporated into the extended TPB. This framework emphasizes the intention to utilize technology, specifically tools of Artificial Intelligence in Education (AIED), to support self-directed learning (SDL) among higher education students in Indonesia. From this conceptualization, eight (8) research hypotheses were formulated.
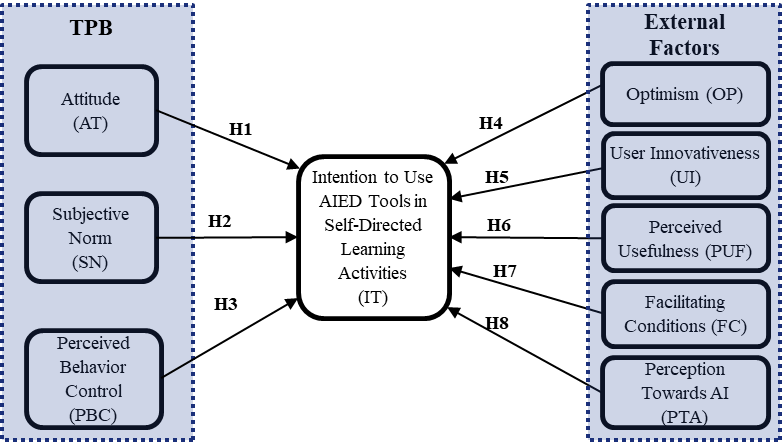
Figure 1. Research Framework
Each of the factors in Figure 1 is hypothesized to have a direct effect on intention, corresponding to hypotheses H1 through H8. The diagram provides a visual alignment of these constructs, illustrating how behavioral, psychological, and environmental elements interact to shape students' adoption behavior. By integrating these dimensions into a unified model, the framework aims to capture both rational decision-making and contextual influences in students’ use of AI-based learning tools.
The TPB is an explanatory model that has been widely applied to the prediction intention (Ajzen, 1985, 2020), this also applies to a variety of behavioral domains (Li et al., 2022). The original components of TPB, including attitude, subjective norm, and perceived behavioral control, have consistently shown their significance in shaping learners’ intention to adopt technology applications for learning (Mohr & Kühl, 2021; Sohn & Kwon, 2020). Furthermore, several previous studies have adopted various TPB constructs to explain users’ intention to adopt technologies such as e-commerce (Ozkan & Kanat, 2011) and smart products (Jang & Noh, 2017; J. Song et al., 2018).
Attitude is believed to be a factor influencing a person's behavioral intention in using technology (Nie et al., 2020; Valle et al., 2024). Numerous empirical studies have demonstrated a positive correlation between attitude and intention (J. V. Chen et al., 2019; Obaid & Aldammagh, 2021). Some scholars assert that an individual's attitude toward a particular technology is an important prerequisite in their willingness to adopt it (Faham & Asghari, 2019; Mengi et al., 2024). For instance, Mohr and Kühl (2021) and Sohn and Kwon (2020) identified users' attitudes toward innovative technologies as a key factor in predicting their intention to adopt such technologies. Based on this relevant research, the following hypothesis is proposed:
H1. Attitude significantly affects the intention to adopt AIED tools for SDL.
Subjective norms pertain to the social pressure or influence that affects an individual's decision to engage in a specific behavior (Ajzen, 1985). The more support individuals receive from influential people or groups in their social environment, the stronger their intention to engage in the behavior of interest (S. Wang et al., 2024). Previous studies have shown that subjective norms have a positive impact on behavioral intentions in the use of technology, such as the use of e-learning (Chu & Chen, 2016), AI technology in secondary schools (Chai et al., 2020), food delivery using drones (Choe et al., 2021), and patent applications (Lin & Yu, 2018). Sohn and Kwon's (2020), study revealed that AI products are highly sought after, although respondents have limited practical experience, as their adoption is heavily influenced by others' opinions, highlighting the strong impact of subjective norms. Thus, based on this premise, this study proposes the following hypothesis:
H2. Subjective norm significantly affects the intention to adopt AIED tools for SDL.
Perceived behavioral control (PBC) is an individual's assessment of how easy it is to perform a desired behavior (Ajzen, 1985; Polyportis, 2023). Individuals with higher PBC over resources, ease, and ability toward behavioral goals are more likely to perform the behavior (Jiao & Cao, 2024). Evidence from certain studies suggests that PBC serves as a positive predictor of technology adoption, such as mobile English learning (Nie et al., 2020), ChatGPT (Polyportis, 2023), and smart farming systems (Mohr & Kühl, 2021). In the context of AIED, individuals' perceived behavioral control may positively predict their intention to use AIED for SDL. Given these relevant studies, the following hypothesis was established:
H3. Perceived behavioral control significantly affects the intention to adopt AIED tools for SDL.
In the theory of Technology Readiness (TR), the optimism and innovativeness factors of users can encourage users to adopt new technologies and have positive intentions toward the technology (Hassan et al., 2024; Parasuraman, 2000; Yen, 2005). These factors often affect perceived ease of use and perceived usefulness (Buyle et al., 2018; M.-F. Chen & Lin, 2018; T. Kim & Chiu, 2019). However, Individuals who are optimistic about new technologies generally tend to have positive intentions to use them because they consider new technologies easier to use and interesting (Jo & Baek, 2023; Madar et al., 2019). This intention also occurs in individuals who have user innovativeness motivations for technology (Strzelecki, 2023). So, based on this, the following two hypotheses are formulated:
H4: Optimism significantly affects the intention to adopt AIED tools for SDL.
H5: User innovativeness significantly affects the intention to adopt AIED tools for SDL.
Perceived usefulness refers to the extent to which an individual holds the belief that utilizing a particular system will improve their job performance and efficiency (Bhattacherjee, 2001; Chatterjee et al., 2021; Venkatesh & Davis, 2000). Perceived usefulness is an important motivator for user intention to use a new technology system (Sun et al., 2022). The perceived usefulness of an AI device depends on the extent to which learners’ use of the AI device leads to improvements in their learning performance (Zhou & Zhang, 2024). In studies related to students' interest in using m-learning technology in Jordan (Althunibat, 2015) and e-learning in Indonesia (Mailizar et al., 2021), it was found that perceived usefulness is a factor that greatly influences students' interest in using the technology in learning. Therefore, the following hypothesis is proposed:
H6: Perceived Usefulness significantly affects the intention to adopt AIED tools for SDL.
Facilitating conditions is a factor that can be defined as the user's assessment of the resources and assistance accessible when engaging in a technological action (Venkatesh et al., 2012). It also consists of the organizational and technical infrastructure aspects (Chawla & Joshi, 2019). In several studies, facilitating condition is a strong factor that influences the user's intention to utilize technology, such as the use of m-banking (Oliveira et al., 2014), online virtual lectures (Shuhaiber, 2016), mobile-assisted language learning (Ebadi & Raygan, 2023), dynamic mathematics software (Yuan et al., 2023), to the use of AI tools for teachers (Velli & Zafiropoulos, 2024). Based on this potential, the following hypotheses are proposed in this regard:
H7:Facilitating condition significantly affects the intention to adopt AIED tools for SDL.
Perception towards AI refer to an individual's or group's understanding and beliefs about AI (Lugito et al., 2024), including benefits of AI (Brauner et al., 2023). Students' perception towards AI also positively impacts their intention to continue using it in learning, because their good perception of AI makes them trust in using AI for learning (Liu & Huang, 2024). On the other hand, if students' perception towards AI is low, it will reduce students' interest in using AI (Fošner, 2024).
H8:Perception towards AI significantly affects the intention to adopt AIED tools for SDL.
Methodology
The study surveyed Indonesian higher education students to understand their intention to adopt artificial intelligence (AI) tools for self-directed learning (SDL) management. To gain insights from multiple perspectives, we used a purposive sample, targeting individuals aged 18 and above studying in higher education with different academic backgrounds and experiences using AI tools. All participants had experience using AI tools in SDL.
Following the recommendations of Bentler and Chou (1987) and Nicolaou and Masoner (2013), which advocate for a minimum of 5–10 responses per estimated parameter and recognizing the emphasis on robust sample sizes highlighted by Assele et al. (2023) and Bujang and Adnan (2016), the study targeted a minimum of 300 participants. This substantial sample size was designed to enhance the statistical power of the research, enabling the detection of subtle effects and providing more precise estimates of population parameters. Consequently, this approach contributes to the generalizability and reliability of the study's findings.
Participants
Table 1 presents an overview of the demographic characteristics of the respondents, comprising a total of 322 participants. Most respondents were female (54.35%) and aged 20–24 years (45.03%). Nearly half were pursuing a bachelor’s degree (49.38%), with a significant proportion enrolled in master’s programs (31.99%). The largest academic fields represented were engineering (27.02%) and education (23.29%).
Then, most of the participants (83.85%) were students studying at universities in Java. Although this region only covers 7% of Indonesia's territory, this region is the most densely populated and most digitally developed region of Indonesia (Buchori et al., 2017). Furthermore, based on data from the Central Statistics Agency of Indonesia, there are 1,409 universities in Java which accommodate 5,349,807 or 63.18% of students throughout Indonesia (Badan Pusat Statistik[Central Bureau of Statistics], 2023). Therefore, it is reasonable that the majority of respondents are concentrated in this region compared to others.
All participants had prior experience using AIED tools in learning and the majority of respondents said that the AIED type they used for the first time was personalized learning. Most respondents have less than one year of experience using AIED in self-learning (50.62%) and most use these AIED tools weekly (59.01%).
Table 1. Respondents Demographic (N = 322)
| Characteristics | Category | Amount | Percentage (%) |
| Gender | Female | 175 | 54.35 |
| Male | 147 | 45.65 | |
| Age | 19 years old or less | 38 | 11.80 |
| 20 – 24 years old | 145 | 45.03 | |
| 25 – 29 years old | 73 | 22.67 | |
| 30 – 34 years old | 28 | 8.70 | |
| 35 – 39 years old | 24 | 7.45 | |
| ≥ 40 years old | 14 | 4.35 | |
| Degree Level (On Going) | Associate Expert | 31 | 9.63 |
| Bachelor | 159 | 49.38 | |
| Profession | 6 | 1.86 | |
| Master | 103 | 31.99 | |
| Doctoral | 21 | 6.52 | |
| Specialist | 2 | 0.62 | |
| Academic Field(On Going) | Arts | 16 | 4.97 |
| Business | 19 | 5.90 | |
| Education | 75 | 23.29 | |
| Engineering | 87 | 27.02 | |
| Medical | 14 | 4.35 | |
| Natural Science | 48 | 14.91 | |
| Social Science | 41 | 12.73 | |
| Other | 22 | 6.83 | |
| University Location (Island) | Java | 270 | 83.85 |
| Kalimantan | 11 | 3.42 | |
| Sumatera | 32 | 9.94 | |
| Sulawesi | 8 | 2.48 | |
| Other | 1 | 0.31 | |
| Have you ever used AIED? | Yes | 322 | 100 |
| No | 0 | 0 | |
| What type of AIED was first used for self-learning? | Intelligent Tutoring System (Ex: Duolingo, Khan Academy) | 89 | 27.64 |
| Personalized Learning (Ex: ChatGPT, Absorb LMS, Docebo) | 218 | 67.70 | |
| Automated Assessment (Ex: University E-learning, iFlyTek) | 15 | 4.66 | |
| Experience using AIED for self-learning | < 1 year | 163 | 50.62 |
| 1-2 years | 117 | 36.34 | |
| > 2 years | 42 | 13.04 | |
| Frequency of using AIED for self-learning | Daily | 44 | 13.66 |
| Weekly | 176 | 54.66 | |
| Monthly | 102 | 31.68 |
Questionnaire
This study employed a combination of closed-ended questions (Connor Desai & Reimers, 2019) and self-reflection prompts (Brownhill, 2021) as indicators in an online survey format to identify potential participants for further data analysis. Online surveys offer several advantages, including convenience for respondents, reduced potential for bias, and enhanced privacy protection, particularly when addressing sensitive topics (Kays et al., 2013; McNeeley, 2012). Responses were collected using a five-point Likert scale ranging from “strongly disagree” to “strongly agree.” The questionnaire was administered online to Indonesian higher education students from August to December 2024. To ensure accessibility and mitigate sample bias, the survey was disseminated across various online social media groups using Google Forms at different times and days throughout the data collection period (S. Singh & Sagar, 2021).
Before initiating large-scale data collection, a pilot test of the questionnaire was conducted with 30 respondents to assess its reliability, as recommended by Bujang & Adnan (2016). These participants were selected to represent a range of academic backgrounds and familiarity with AI tools to ensure that the questionnaire was understandable to a wide range of respondent profiles.
During the pilot test, respondents were asked to complete the full survey and provide qualitative feedback on aspects such as item clarity, question relevance, ambiguity of wording, and appropriateness of the response scale. Some participants noted that they had difficulty interpreting the meaning of constructs such as “user innovation” or “perceived usefulness” without clear definitions on the form. Based on this feedback, we provided brief definitions on the form for each construct asked to make it easier to understand what it meant and so that each item in each construct could be answered appropriately.
In addition to reviewing the qualitative feedback and then following up with improvements, quantitative analysis was also conducted. Validity checks were performed using IBM SPSS 26, yielding an average Cronbach’s alpha score of .794 from the pilot survey, exceeding the commonly accepted threshold of .7 (Taber, 2018). These results indicate good internal consistency among the indicators, confirming the suitability of the research instrument for subsequent data collection. Table 2 presents the latent variables, and their corresponding indicators utilized in this study.
Table 2. Three-Point Likert Scale Question for Problem Definition
| Latent Variable | Item Code | Items | Reference |
| Attitude | AT1 | I believe that AI tools will improve my tasks and assignments. | Valle et al. (2024) |
| AT2 | I think that AI tools contribute to more productivity results. | Valle et al. (2024) | |
| AT3 | I think using AI tools is positive for my work. | Valle et al. (2024) | |
| AT4 | I believe that AI will improve my life as a student. | Valle et al. (2024) | |
| AT5 | AI can be used as a quality control system to evaluate the learning. | Mengi et al. (2024) | |
| Subjective Norm | SN1 | My teachers believe it is necessary to learn how to use AI tools in learning. | S. Wang et al. (2024) |
| SN2 | My senior believes it is necessary to learn how to use AI tools in learning. | S. Wang et al. (2024) | |
| SN3 | My classmate believes it is necessary to learn how to use AI tools in learning. | S. Wang et al. (2024) | |
| SN4 | My family supports me in learning how to use AI tools. | S. Wang et al. (2024) | |
| SN5 | People I admire or look up to often use AI, which makes me more likely to do the same. | Chai et al. (2020) | |
| Perceived Behavioral Control | PBC1 | Learning using AI is relatively easy for me. | Polyportis (2023) |
| PBC2 | Using AI Tools as a student is entirely within my control. | Polyportis (2023) | |
| PBC3 | I have the knowledge and the ability to make use of AI Tools as a student. | Polyportis (2023) | |
| PBC4 | I could accept AI as a teacher and good friend in learning. | Suh and Ahn (2022) | |
| Optimism | OP1 | Using AI tools in learning activities is interesting. | Kampa (2023) |
| OP2 | I am sure AI tools can give me more freedom of mobility in learning. | Kampa (2023) | |
| OP3 | I am confident that I can do many tasks on time because of AI. | Kampa (2023) | |
| OP4 | I like the idea of using AI tools in education. | Kampa (2023) | |
| User Innovativeness | PI1 | I like to experiment with new AI tools. | Strzelecki (2023) |
| PI2 | When I hear about a new AI tool, I look for ways to experiment and try it in learning. | Strzelecki (2023) | |
| PI3 | I am often among the first in my social circle to try out a new AI tool. | Strzelecki (2023) | |
| PI4 | Overall, I do not hesitate to try out a new AI tool, especially in learning activities. | Strzelecki (2023) |
Table 2. Continued
| Latent Variable | Item Code | Items | Reference |
| Perceived Usefulness | PUF1 | Learning with AI tools can improve my learning efficiency. | Zhou and Zhang (2024) |
| PUF2 | Learning with AI tools can help me with my study tasks. | Zhou and Zhang (2024) | |
| PUF3 | My experience of using AI tools for online learning is very satisfactory. | Zhou and Zhang (2024) | |
| PUF4 | AI tools produce more good suggestions than bad. | Suh and Ahn (2022) | |
| PUF5 | AI tools have feature which can solve my problem of understanding a lesson. | Suh and Ahn (2022) | |
| Facilitating Condition | FC1 | AI tools are compatible with the technologies I have and use. | Velli and Zafiropoulos (2024) |
| FC2 | When I have problems using AI, some colleagues or experts are ready to help me. | Velli and Zafiropoulos (2024) | |
| FC3 | I have the financial resources necessary to subscribe to AI tools. | Shuhaiber (2016) | |
| FC4 | I have access to a suitable place to use Wi-Fi or provide a device. in case I face issues with my internet connection and personal device. | Ebadi and Raygan (2023) | |
| FC5 | My schools provide appropriate lesson and equipment conditions regarding AI in learning. | Y. Song and Wang (2024) | |
| Perception Towards AI | PTA1 | I trust AI because I understand the its principle and limitations in education. | Buabbas et al. (2023) |
| PTA2 | I feel all students should study with AI as it will benefit their career. | Buabbas et al. (2023) | |
| PTA3 | I feel comfortable using AI in learning. | Buabbas et al. (2023) | |
| PTA4 | I believe AI will replace specializations in education within my lifetime. | Buabbas et al. (2023) | |
| Intention | IT1 | I am willing to learn about the experience of AI tools by learning from others. | An et al. (2023) |
| IT2 | I am willing to learn the case of AI education applications from the Internet. | An et al. (2023) | |
| IT3 | I am happy to share my AI knowledge and experience in learning activity with others. | An et al. (2023) | |
| IT4 | I intend to use AI tools for learning in the future. | An et al. (2023) | |
| IT5 | I will keep myself updated with the latest AI tools in learning. | Chai et al. (2020) |
Artificial Neural Networks (ANN) Model
El-Sefy et al. (2021) highlighted that a neural network could serve as the optimal tool when the model has been properly trained. This study uses Artificial Neural Network (ANN) instead of traditional Structural Equation Modeling (SEM) to model students’ behavioral intention due to the unique advantages offered by ANN in handling complex linear and nonlinear relationships (Aghaei et al., 2023). In addition, Zabukovšek et al. (2018) and Sohaib et al. (2020) mentioned in their study that ANN can model relationships with high predictive accuracy compared to SEM methods. While SEM is well-suited to test theory-based linear paths and causal structures, it relies on several assumptions, including data normality, linearity, and measurement error constraints. In contrast, ANN does not require such assumptions and is more flexible in capturing nonlinear patterns and interactions between variables, making it very effective for modeling complex human behavior (Guo et al., 2025). In addition, SEM does not perform well in big data, meanwhile ANN can process big data (Grnholdt & Martensen, 2005). Thus, ANN was chosen in this study.
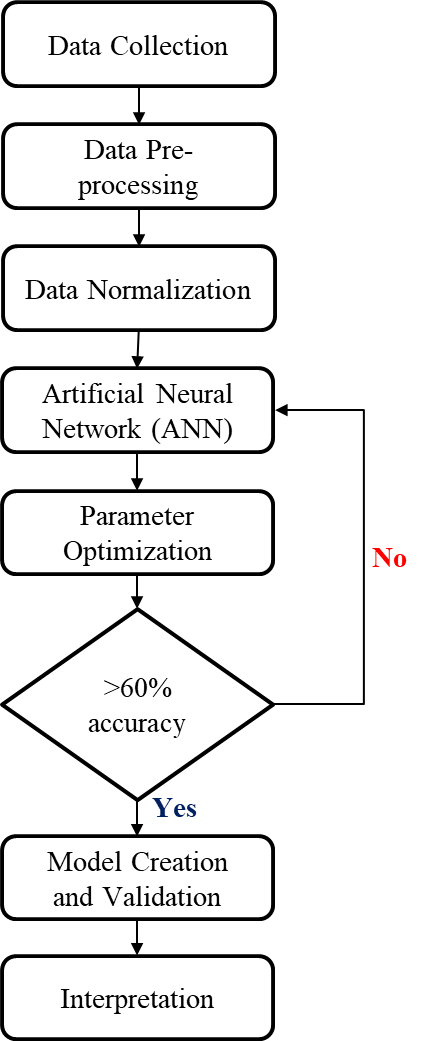
Figure 2. Methodological Flowchart
The researchers utilized Python and Spyder software to run the ANN model. The model implemented in this study utilized one input layer, one hidden layer, and one output layer (Hegde & Rokseth, 2020; Zhong et al., 2021). Eight nodes were considered for the input layer to represent the eight independent variables: AT, SN, PBC, OP, UI, PUF, FC, and PTA. On the other hand, the nodes for the hidden layer varied from 10 to 50 based on the design of the experiment. Lastly, these nodes are connected to the output layer's single node, which embodies the independent variable IT. The ANN model employed a feed-forward process considering various activation functions and optimizers for the forward and back propagation procedure. Figure 2 is presented the methodological flowchart of the detailed process.
Data Pre-Processing
Before the statistical and machine learning analysis, the collected data were pre-processed accordingly. A respondent is required to provide feedback on questions in all variables, consisting of 41 items. In the Google Form setting, these 41 questions are set to be mandatory to answer. The respondent cannot submit the form if there is an unanswered question. The researchers considered a total of 13,202 data obtained from the results of 322 respondents and 41 inputs made by each respondent. Based on checking through IBM SPSS Statistics software, no missing values were found. Furthermore, the data was refined through correlation analysis as a statistical method that is used to discover if there is a relationship between variables or datasets. It applies a threshold of .20 for the correlation coefficient and a p-value of .05 to identify significant indicators (Franco-Gonçalo et al., 2024).
ANN Optimization
Following data pre-processing, the aggregated data was optimized to implement the ANN, a supervised machine learning algorithm that mimics the biological nervous system using artificial neurons (Njock et al., 2021). The neural network mechanism operates through mathematical functions designed to detect patterns within large datasets in a feed-forward manner (Yousefzadeh et al., 2021). The ANN's input layer comprises artificial neurons that represent the aggregated data, which is subsequently processed to identify non-linear relationships as it passes through hidden layers before reaching the output layer. German et al. (2022) highlight that ANN is highly effective for analyzing non-linear correlations and serves as a valuable tool for studying human behavior.
Based on various studies that utilize machine learning algorithms to predict human behavior, as outlined in Table 3, the activation functions evaluated for the hidden layer include Swish (Janjua et al., 2023; Ramachandran et al., 2017), ReLu (Eckle & Schmidt-Hieber, 2019; Janjua et al., 2023), and Tanh (Lederer, 2021; Maurya et al., 2023). For the output layer, the activation functions considered are Softmax (Shatravin et al., 2023; Zheng et al., 2023), and Sigmoid (Elfwing et al., 2018; Shatravin et al., 2022). The Adam optimizer was employed during the initial optimization phase (Irfan et al., 2023; Yang, 2024). Each parameter combination underwent 10 iterations across 150 epochs, taking into account the hidden layer nodes (Gumasing et al., 2023).
The train-test split ratio remained constant at 80/20, aligning with the Pareto principle. To ensure a statistically robust evaluation, a total of 7,200 model runs were conducted. Each parameter combination was executed 10 times, with each run training the model for 150 epochs. This comprehensive approach aims to identify the optimal ANN configuration for this study (Gumasing et al., 2023; Zhong et al., 2021).
Table 3. ANN Parameters
| Items | Parameters | References |
| Hidden Layer Activation Functions | Swish | (Janjua et al., 2023; Ramachandran et al., 2017) |
| ReLu | (Eckle & Schmidt-Hieber, 2019; Janjua et al., 2023) | |
| Tanh | (Lederer, 2021; Maurya et al., 2023) | |
| Output Layer Activation Functions | SoftMax | (Shatravin et al., 2023; Zheng et al., 2023) |
| Sigmoid | (Elfwing et al., 2018; Shatravin et al., 2022) | |
| Optimizers | Adam | (Irfan et al., 2023; Yang, 2024) |
Results
Constructs Validity and Reliability
The reliability and validity of the measurement model were evaluated using various statistical metrics. Table 4 provides an overview of the descriptive statistics, including the factor loadings, Cronbach’s alpha, composite reliability, and average variance extracted (AVE) for each latent variable in the model.
The factor loadings indicate the strength of the relationship between each indicator and its corresponding latent variable. All factor loadings exceeded the recommended threshold of .7, confirming that the indicators effectively measured their respective constructs (Hair et al., 2019). Internal consistency and reliability were assessed using Cronbach's alpha and composite reliability, both of which should surpass the minimum threshold of .70 for acceptability (Taber, 2018). As shown in Table 4, all latent variables achieved Cronbach's alpha and composite reliability values ranging from .718 to .926, demonstrating satisfactory reliability. Convergent validity, measured by the average variance extracted (AVE), reflects the extent to which indicators within a construct are correlated. An AVE value above .5 is deemed acceptable, indicating that the indicators adequately capture the intended construct (dos Santos & Cirillo, 2021). The AVE values for all latent variables in this study ranged from .539 to .713, meeting this criterion.
These results affirm the strong psychometric properties of the measurement model. The robust factor loadings, Cronbach's alpha, composite reliability, and AVE values confirm the reliability and validity of the indicators, ensuring the quality of the data for further analysis (Hair et al., 2019).
Table 4. Factor Loading, Cronbach’s Alpha, Composite Reliability, and Average Variance Extracted
| Latent Variable | Item Code | Factor Loading | Cronbach’s Alpha | Composite Reliability | Average Variance Extracted |
| Attitude | AT1 | .856 | .892 | .980 | .681 |
| AT2 | .831 | ||||
| AT3 | .869 | ||||
| AT4 | .840 | ||||
| AT5 | .775 | ||||
| Subjective Norm | SN1 | .818 | .753 | .834 | .586 |
| SN2 | .730 | ||||
| SN3 | .738 | ||||
| SN4 | .850 | ||||
| SN5 | .822 | ||||
| Perceived Behavioral Control | PBC1 | .814 | .718 | .823 | .539 |
| PBC2 | .760 | ||||
| PBC3 | .721 | ||||
| PBC4 | .790 | ||||
| Optimism | OP1 | .832 | .729 | .835 | .637 |
| OP2 | .834 | ||||
| OP3 | .711 | ||||
| OP4 | .750 | ||||
| User Innovativeness | PI1 | .822 | .794 | .888 | .678 |
| PI2 | .881 | ||||
| PI3 | .783 | ||||
| PI4 | .787 |
Table 4. Continued
| Latent Variable | Item Code | Factor Loading | Cronbach’s Alpha | Composite Reliability | Average Variance Extracted |
| Perceived Usefulness | PUF1 | .746 | .853 | .897 | .655 |
| PUF2 | .834 | ||||
| PUF3 | .777 | ||||
| PUF4 | .859 | ||||
| PUF5 | .841 | ||||
| Facilitating Condition | FC1 | .830 | .849 | .871 | .640 |
| FC2 | .828 | ||||
| FC3 | .770 | ||||
| FC4 | .788 | ||||
| FC5 | .785 | ||||
| Perception Towards AI | PTA1 | .772 | .835 | .869 | .660 |
| PTA2 | .716 | ||||
| PTA3 | .826 | ||||
| PTA4 | .831 | ||||
| Intention | IT1 | .861 | .920 | .926 | .713 |
| IT2 | .781 | ||||
| IT3 | .886 | ||||
| IT4 | .834 | ||||
| IT5 | .853 |
Final ANN Model Plots and Results
To determine the optimal ANN architecture, the training process is conducted over sufficient number of epochs to ensure the stability of the loss function across both the training and test sets. This approach helps prevent overfitting and ensures the selection of a model that generalizes well to unseen data. Figure 3 shows the chosen ANN architecture, which includes multiple input factors, a hidden layer with 80 nodes, and an output node representing the IT.
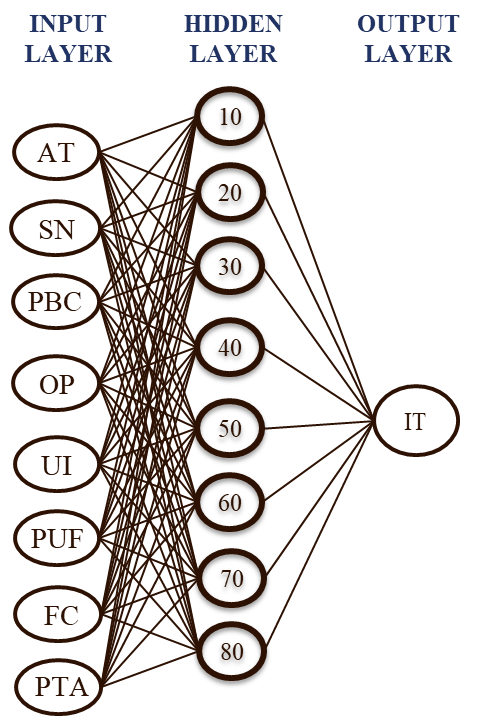
Figure 3. Optimum ANN Model
With the optimized parameters, the model achieved a remarkable peak accuracy of 98.12% on the SN variable. The training and test loss plots for this variable demonstrate the absence of overfitting or underfitting, consistent with the patterns observed in the AT, PBC, PUF, FC, OP, and PTA variables. The progressive decrease in training loss across epochs, accompanied by a similar trend in validation loss with minimal divergence, reflects a well-fitted model (Aliferis & Simon, 2024; Gavrilov et al., 2018). The graph shows that training loss and validation loss consistently decrease together, with a small gap between them, with validation loss slightly higher than training loss. This observation is substantiated by Figure 4, which visually corroborates these findings.
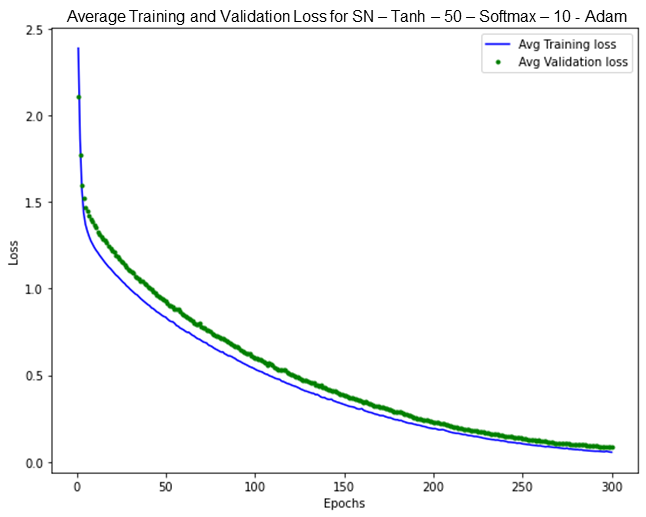
Figure 4. Example high accuracy plot (SN)
Table 5 provides a comprehensive overview of the optimization process performed for ANN, showing the optimal parameters identified for each feature. Drawing on insights from various studies, these parameters were carefully evaluated and ranked based on their average test performance, which tells about the relative importance of each feature regarding the dependent variable (German et al., 2022). The ANN model with the highest accuracy and the lowest standard deviation is considered to reflect the effect of the feature on the dependent variable.
Table 5. ANN Summary of Results
| Factors | Node H | Activation H | Activation O | Optimizer | Average Train | Train – Std.Dev. | Average Test |
| SN | 50 | tanh | softmax | adam | 0.3268 | 0.0419 | 98.12% |
| AT | 50 | swish | softmax | adam | 0.3046 | 0.0407 | 95.91% |
| PBC | 50 | swish | sigmoid | adam | 0.3129 | 0.0288 | 95.40% |
| PUF | 50 | relu | sigmoid | adam | 0.3625 | 0.0324 | 94.43% |
| FC | 50 | tanh | softmax | adam | 0.3622 | 0.0382 | 94.39% |
| OP | 50 | swish | softmax | adam | 0.3420 | 0.0361 | 93.70% |
| PTA | 50 | relu | softmax | adam | 0.3423 | 0.0523 | 92.39% |
| UI | 50 | swish | softmax | adam | 0.3581 | 0.0664 | 83.11% |
Each row in Table 5 represents a separate model run for a single predictor, showing the technical configuration and the resulting predictive accuracy. The key parameters include the number of hidden layer nodes (Node H), the activation functions used in both the hidden and output layers, the optimizer (in this case, Adam), and performance metrics such as average training accuracy, training standard deviation, and average test accuracy.
In practical terms, the average test accuracy reflects how well each variable predicts the intention (IT) when evaluated on unseen data. For instance, subjective norms (SN) achieved the highest accuracy at 98.12%, indicating it is the most reliable predictor of students’ behavioral intention in this study. Other variables like attitude (AT), perceived behavioral control (PBC), and perceived usefulness (PUF) also showed high accuracy levels (above 94%), suggesting strong influence and predictive consistency. The low standard deviation values (Train – Std.Dev.) across variables indicate that the model’s performance is stable and not highly sensitive to data fluctuations. Conversely, User Innovativeness (UI) yielded the lowest predictive accuracy (83.11%) and the highest standard deviation, suggesting that this factor may not consistently influence intention and might introduce variability or noise into the model. Overall, the ANN configuration in this study demonstrates robust and reliable performance, especially for variables closely tied to social and motivational factors.
Based on the data processed, 7 (seven) variables in the ANN model demonstrated high test accuracy, as presented in Table 5. However, it is important to note that 1 (one) variable, PI, exhibited potential signs of overfitting, as evidenced by the individual test-train loss plot shown in Figure 5. Overfitting occurs when the training loss decreases significantly while the validation loss either increases or plateaus (Aliferis & Simon, 2024). This unstable and non-decreasing together in the validation and training loss indicates the model's inability to effectively capture the underlying patterns, resulting in weak accuracy (Gavrilov et al., 2018). In this study, the lower accuracy and greater variability associated with the UI factor suggest overfitting, meaning the model may have captured patterns specific to this dataset but not applicable to broader student populations.

Figure 5.Example overfitting plot (UI)
Result Validation
The ANN model effectively validated the hypothesized relationships between various factors and IT. Table 6 displays the test accuracy for each hypothesis. Seven relationships achieved high accuracy with a low standard deviation, indicating statistically significant results, and were supported by the ANN method. However, there is one relationship with below 90% accuracy, it is UI to IT.
Table 6. Validation of Hypothesis For ANN
| H | Factors | Average Test | Test – Std.Dev. | Result | Hypothesis |
| H2 | SN → IT | 98.12% | 0.0143 | Positive | Accepted |
| H1 | AT → IT | 95.91% | 0.0265 | Positive | Accepted |
| H3 | PBC → IT | 95.40% | 0.0206 | Positive | Accepted |
| H6 | PUF → IT | 94.43% | 0.0219 | Positive | Accepted |
| H7 | FC → IT | 94.39% | 0.0294 | Positive | Accepted |
| H4 | OP → IT | 93.70% | 0.0335 | Positive | Accepted |
| H8 | PTA → IT | 92.39% | 0.0254 | Positive | Accepted |
| H5 | UI → IT | 83.11% | 0.0473 | Positive | Relative Accepted |
To assess the overall performance of the ANN model, a Taylor diagram in Figure 6 was generated. The Taylor diagram has emerged as a valuable tool in the field of machine learning, enabling researchers to compare the performance of various algorithms across multiple metrics (Anwar et al., 2024; Ghalami et al., 2020). This approach is particularly well-suited for the present study, as it allows for a comprehensive evaluation of the chosen ANN model. This diagram is a useful metric for evaluating the similarity between modeled and observed values by considering three key statistics: correlation coefficient, standard deviation, and centered root mean square error (RMSE). From the diagram, the models exhibited robust significance, characterized by correlation values exceeding 80% and RMSEA values below 20%. These results underscored consistent and reliable findings, with strong correlations indicating considerable accuracy rates, thus affirming the reliability of the ANN model (Izzaddin et al., 2024).
Furthermore, the type of ANN Taylor diagram as shown in Figure 6 allows simultaneous comparison of three critical statistical metrics: the standard deviation (plotted along the radial axes), the correlation coefficient (represented by curved lines), and the centered root mean square error (RMSE, shown as concentric red arcs). In this visualization, each symbol represents one predictor variable (e.g., SN, AT, PBC), with its proximity to the origin indicating better model performance. The closer a point is to the reference point (usually the observed or ideal value), the higher the correlation and the lower the error, signaling a stronger and more accurate prediction.
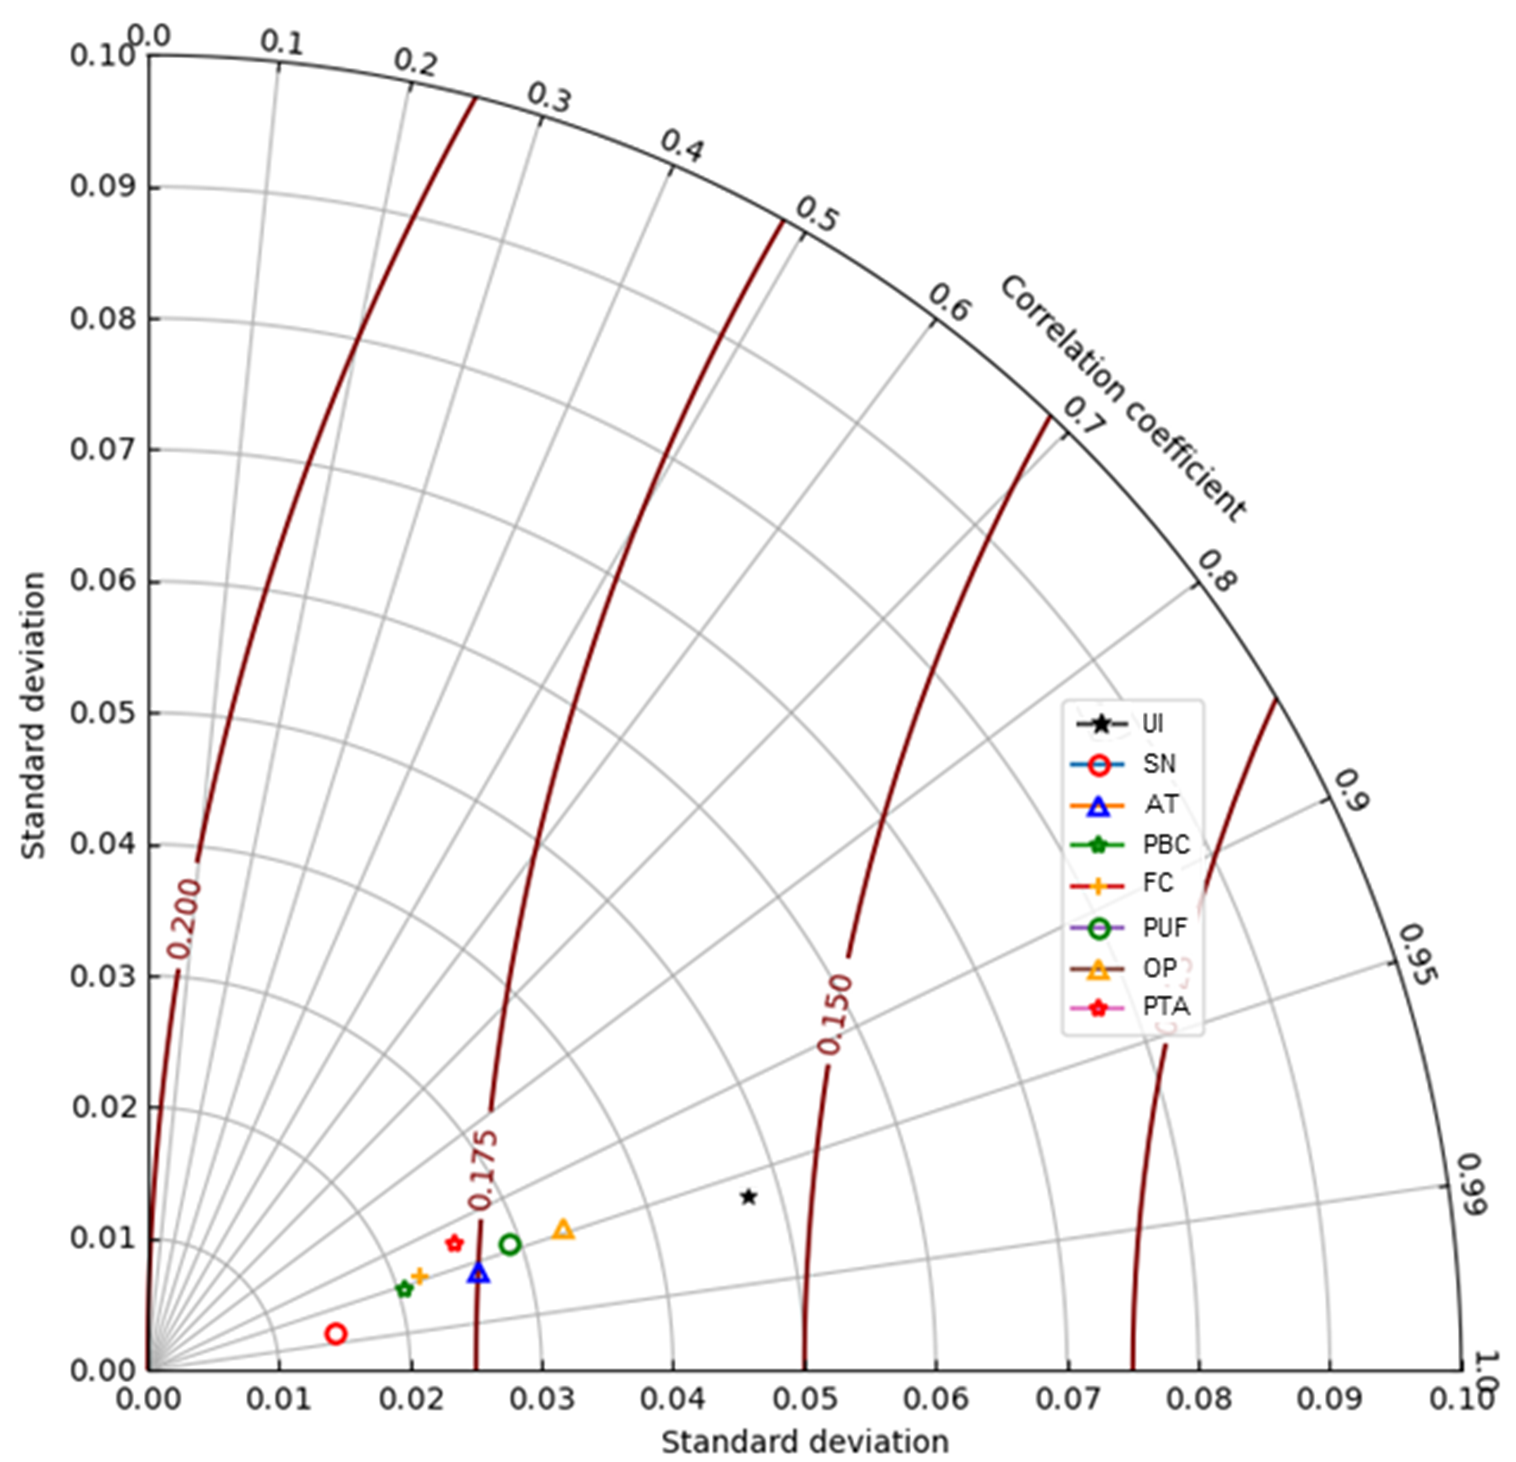
Figure 6. ANN Taylor Diagram
Moreover, as illustrated in the diagram, most variables, including subjective norms (SN), attitude (AT), and perceived behavioral control (PBC) cluster near the origin, reflecting high correlation coefficients (above .95) and low standard deviations and RMSE values. This confirms the ANN model’s robustness and precision in predicting the intention to adopt AIED tools. Conversely, the user innovativeness (UI) variable is plotted farther from the origin, indicating weaker predictive accuracy and potential overfitting. Overall, the Taylor diagram provides a concise and comprehensive visual summary that validates the ANN model’s high performance and helps identify which behavioral factors contribute most significantly to the intention to use AIED in self-directed learning.
Discussion
Eight (8) factors were analyzed where perceived benefits were found to have the highest significant influence. Subjective Norm (SN) was seen to be the most significant factor affecting IT at 98.12%. AT, PBC, PUF, FC, OP, and PTA also influenced IT with high significance with accuracy of more than 90%. However, UI was found to be not significant to IT (accuracy below 90%) due to the have shown signs of overfitting in the model. Table 6 presents a summary of the accepted hypothesis outputs due to significance.
The findings of this study reveal several key insights into the behavioral intention of Indonesian higher education students to adopt AIED tools for self-directed learning (SDL). The high predictive accuracies observed in Subjective Norms (SN), Attitude (AT), and Perceived Behavioral Control (PBC) emphasize the strong influence of social, emotional, and control-related factors on students' technology adoption behaviors. These high behavioral intention scores suggest that students are not only aware of AIED tools but are also strongly inclined to integrate them into their learning routines, especially when supported by peers, mentors, and their academic environment.
The significance of SN as the strongest predictor highlights the importance of social influence and peer validation in technology use, particularly in a collectivist culture like Indonesia’s. Educational institutions should therefore focus on leveraging peer networks and instructor endorsements to promote AIED use. This is supported by research by C. Wang et al. (2024), where it was found that subjective norms encourage students to use AI in learning.
Furthermore, the high influence of AT and PBC implies that students’ positive perceptions and confidence in using AIED tools are crucial for adoption, suggesting that training programs and awareness campaigns could further enhance uptake. AT was found to be the second most significant factor, thereby supporting H1. This indicates that students view AIED as something important and enjoyable for SDL. Andrews et al. (2021) stated that attitude has a significant impact on librarians’ intention to adopt AI. In addition, PBC was the third significant factor that influenced the intention of students to use AIED in SDL, thereby supporting H3. This indicates that students have the ability or experience in using AIED, so they do not find it difficult to use and control it. Mohr and Kühl (2021) in their study stated that perceived behavioral control has the most influence on AI acceptance.
PUF was also found to have a significant factor in the students' intention to use AIED for SDL, thereby supporting H6. This refers to the level of student’s confidence in the usefulness of a specific technology that will improve their performance or help them achieve certain goals. In research conducted by Alhashmi et al. (2020), PUF was one of the critical success factors required to implement AI projects in the health sector in providing services for patient monitoring. The next variable, FC was found to be the significant factor of intention, thereby supporting H7. This is an indication that students have essential resources such as supporting technology, financial, and infrastructure. Xian (2021) stated that facilitating condition is a significant indicator of intention to use AI in leisure. Another factor, OP, has been proven to have a significant factor in the intention to use AIED in SDL, thereby supporting H4. High results on this factor mean that students are optimistic that AIED will be easy to use and interesting for them. In research conducted by Jo and Baek (2023), optimism affects the continued intention to use AI personal assistants. After that, PTA has been proven to be a significant factor in the intention to use AIED tools among Indonesian higher education students, thereby supporting H8. The results indicate that the majority of students have a good PTA related to AIED and trust in its use. In addition, according to Ajitha et al. (2024), perception towards AI is also related to user satisfaction in using AI applications in respondents' daily lives in Karnataka, India. This will certainly provide output in the form of continuous intention to use AI.
UI was found to be the last significant factor of intention in this study, thereby supporting H5, but has a lower significance than other variables due to it being below 90%. UI is the tendency to be a technology pioneer or early adopter, an individual desires to experiment and explore AIED tools before they become mainstream. This finding is somewhat unexpected, as innovativeness is often associated with early adoption. However, in this context, it may reflect a tendency among students to wait for social validation before exploring new tools, indicating a gap between curiosity and actual usage. This may also point to barriers such as lack of time, confidence, or access to training that prevent even tech-curious students from adopting AIED tools independently. These results also show that students' desire to become pioneers in the use of AIED is still not very high. Several studies found that there is no effect of user innovativeness on the adoption intention of some types of technologies (Ciftci et al., 2020; Liljander et al., 2006; Melián-González et al., 2019). However, Okumus et al. (2018) stated that innovativeness is a significant factor in intention to use.
The ANN model's overall strength in prediction, with average accuracy of 93.43%, reinforces the suitability of machine learning in educational behavioral studies. The consistency of high accuracy and low standard deviation across most variables suggests that the model captured relevant non-linear relationships well. However, one limitation is the lower accuracy and greater variance in UI, which might be due to external factors not captured in the current model, such as institutional support, prior tech experience, or personality traits. Future studies could consider integrating these additional dimensions or testing hybrid models to further refine prediction reliability.
Theoretical Implication
Previous studies have been conducted to predict students' intention to use technology, including AIED. In this study, evaluating Indonesian higher education students' intention to use AIED tools for self-directed learning (SDL) through machine learning ensembles demonstrates strong predictive power, revealing the factors that contribute to this intention. One of the algorithms used in this study is the ANN, which is favored for pattern recognition because it simulates the biological functions of neurons in the brain (Harsh et al., 2016; Manning et al., 2014). Generally, ANN is applied for classifying large datasets, forecasting time series, and performing function estimation or regression (Gallo, 2015). In terms of prediction, ANN has been shown to outperform statistical methods like function estimation or regression, due to its ability to conduct multi-layered analyses of complex data sets, resulting in higher predictive and classification accuracy (Cakir & Sita, 2020). In a similar context, Niazkar & Niazkar (2020) employed ANN to estimate COVID-19 cases across multiple countries to support the development of health-related policies based on observed data patterns. In addition, Shanbehzadeh et al. (2022) used ANN to predict the mortality risk in hospitalized COVID-19 patients in 1,710 hospitals in Iran to help related parties in preparing bed availability and further treatment for patients. Thus, ANN played a crucial role in shaping and evaluating policies and strategies, including their effectiveness, during the COVID-19 pandemic.
Compared with the existing literature on the interest in using AI, this study provides a new and comprehensive approach to analyzing the factors for using AIED, especially in self-paced learning. Nevertheless, the results of this study show a high level of accuracy of ANN with 93.43% average. It can be concluded that the accuracy level of ANN is reliable and can be used as a framework for future research under the same discipline.
Practical Implication
Assessing the factors that influence the intention to use AIED tools for SDL among Indonesian college students is crucial for technology developers and educators. The findings indicate that subjective norms (SN), representing social influence, emerge as the most significant determinant of students' intention to use AIED tools. This underscores that students are strongly motivated by the desire to align with prevailing social trends and avoid being left behind by their peers. On the other hand, the factor with the lowest influence, user innovativeness (UI), highlights a limited inclination among students to embrace innovation or take the initiative as early adopters or pioneers of AIED tools. In the context of newly introduced AIED applications, students tend to defer adoption until their social environment has first demonstrated usage, rather than independently pioneering the technology.
Conclusion
Based on the application of artificial neural networks, it was determined that 8 (eight) constructs significantly influenced university students' intention (IT) to use AIED tools for SDL purposes. The ANN model demonstrated an impressive average accuracy rate of 93.43% with a standard deviation of 0.0274 across 150 epochs and 80 hidden nodes, confirming the reliability of the analysis without overfitting. Among the analyzed constructs, subjective norms (SN) emerged as the most significant factor influencing the intention to adopt AIED tools as the IT construct, achieving a predictive accuracy of 98.12%. This underscores the role of social influence in shaping students' decisions, where peer pressure and recommendations from respected individuals significantly drive adoption behavior.
From the perspective of educational management, this study provides actionable insights. The significant role of SN and AT suggests the need for educational institutions to foster a supportive social environment and positive attitudes toward AIED tools in learning activities. Investments in facilitating conditions, such as infrastructure and financial support, are also important, as indicated by the strong influence of FC on students' intentions in this study.
This study contributes to the growing body of literature on AIED and serves as a framework for future research on technology adoption in education, particularly in developing countries like Indonesia, where there remains significant potential for scaling such innovations. Moreover, the application of machine learning ensembles effectively predicted college students' intentions and technology acceptance, as evidenced by the high level of accuracy demonstrated in this study's findings. Therefore, this research framework can serve as a valuable foundation for future studies exploring human behavior.
Recommendations
Based on the study’s findings, several targeted recommendations are proposed to increase the adoption of AIED tools for self-directed learning among Indonesian university students. First, educational institutions should harness the power of social influence by encouraging peer collaboration and instructor support, as Subjective Norm emerged as the most significant predictor of behavioral intention. Second, promoting positive attitudes and strengthening student self-confidence through structured training and orientation programs can also increase adoption, especially by highlighting the ease and value of AI tools. Third, ensuring adequate infrastructural support, such as internet access, technical guidance, and integration of AIED platforms into the learning ecosystem, remains critical, given the strong role of Facilitating Conditions and Perceived Usefulness. Fourth, increasing student familiarity and trust in AI technologies through basic AI literacy initiatives and practical exposure can further build acceptance. Fifth, and most importantly, regional disparities in access and readiness should be addressed through inclusive policy strategies that expand digital resources. These recommendations align with the behavioral, technical, and perceptual factors analyzed in this study and offer practical direction for educators, developers, and policymakers. This research yields a new, empirically validated model that not only explains students’ intentions to use AIED but also informs strategic actions to support equitable and sustainable AI integration in education.
Limitations
The findings of this study present promising results that can serve as a foundation for future research on the adoption of AIED tools for students' SDL in higher education. However, there are still two aspects that can be further evaluated because there are limitations observed in this study. First, the majority of respondents who participated in the digital survey were university students from Java Island, which may have influenced their level of technological facility and experience. Second, this study has not taken into account the demographic characteristics of respondents, such as gender, age, education level, and field of study to be processed into machine learning as factors that may influence the use of AIED.
Ethics Statements
The submitted work is original and has not been published elsewhere in any form or language (partially or fully). The studies involving human participants were reviewed and approved by the Ethics Committee of Yogyakarta State University. All participants gave written informed consent to participate in the study. All relevant ethical guidelines and principles were carefully considered during the preparation of this article. The research, including data collection, analysis, and interpretation, was conducted according to strict ethical standards to minimize any potential impacts on humans and the environment. A comprehensive ethical evaluation was performed prior to the study, assessing all potential risks and benefits. Participation in the study was voluntary, and informed consent was obtained from all participants. The privacy and confidentiality of participants were maintained, and appropriate measures were taken to ensure anonymity.
Conflict of Interest
The authors declare no conflicts of interest.
Authorship Contribution Statement
Darmono: Conceptualization, design, reviewing, securing funding, supervision. Setiawan: Data acquisition, data analysis, statistical analysis, format editing, final approval. Ma’ruf: Technical support, material support, drafting manuscript.
Generative AI Statement
As the authors of this work, we used the AI tool included in Machine Learning (ML), namely Artificial Neural Network (ANN) for the purpose of data processing. After using this AI tool, we reviewed and verified the final version of our work. We, as the author(s), take full responsibility for the content of our published work.